2020 Presidential Election Prediction Reflection
By Miroslav Bergam
November 23rd, 2020
Model Recap
My 2020 Presidential Election model predicted the two-party vote share for President Trump and Former Vice President Joe Biden in each state. My model was trained on all Democratic and Republican candidates from the 1988 to 2016 Presidential Elections. Its variables are composed of each party’s vote share by state in the previous presidential election, each candidate’s post-convention polling average by state, which candidate was the incumbent or a member of the incumbent party, and the incumbent’s latest published national approval rating. The final formula for my model was as follows:
pv2p ~ last_election + average_poll + incumbent + incumbent_party + approval
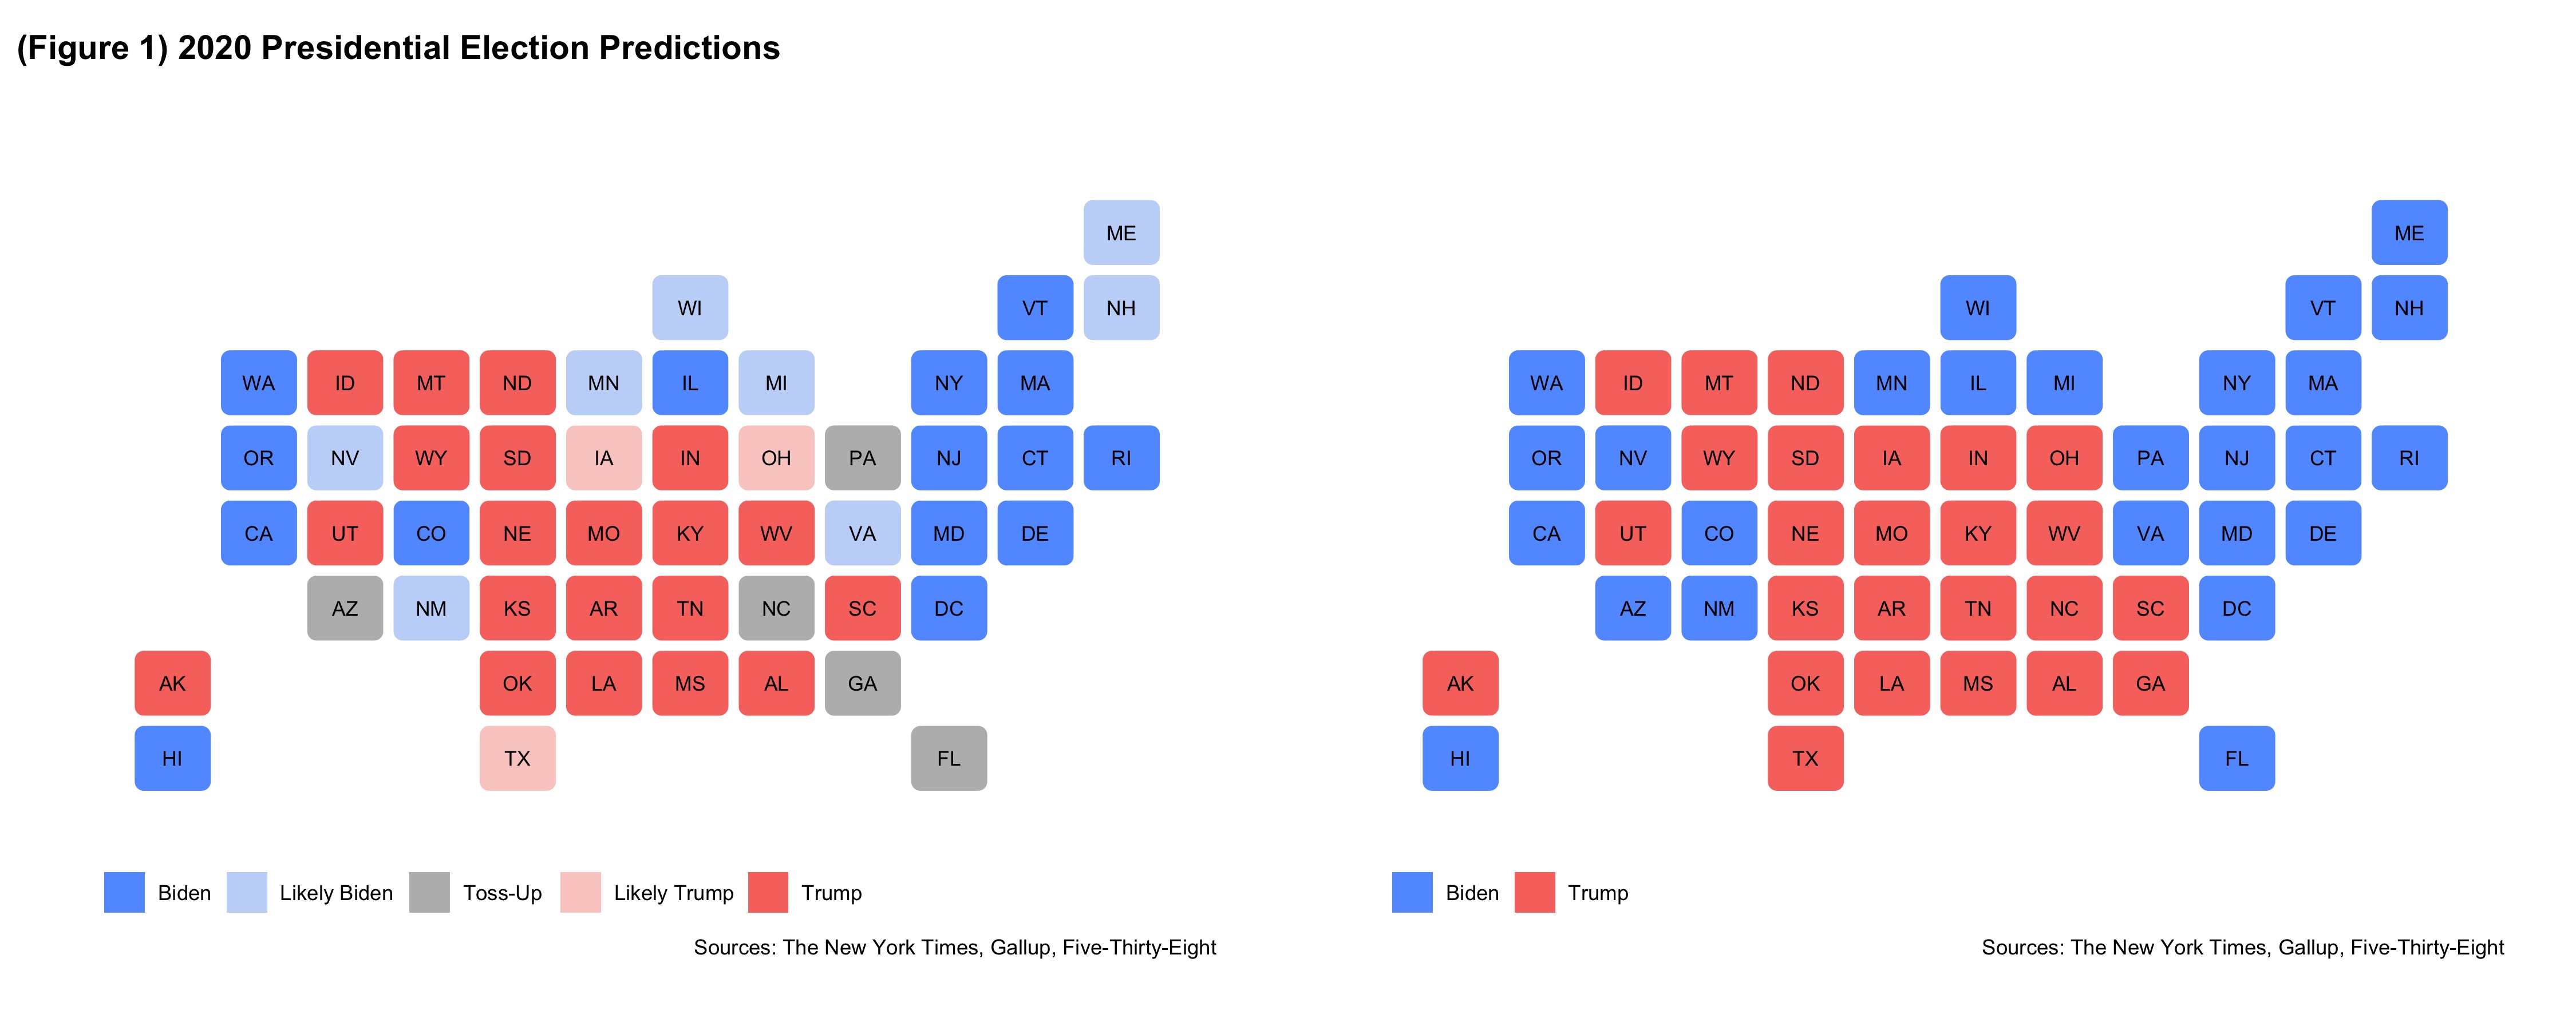
After feeding my model the 2016 Presidential Election vote shares by state, Biden and Trump’s post-convention polling averages, Trump’s status as the incumbent, and Trump’s national approval rating preceding the election, my model projected the maps below as the outcome of the 2020 Presidential Election. The map on the left demonstrates my levels of certainty for who would win each state and the map on the right shows my final predictions for all states.
Accuracy
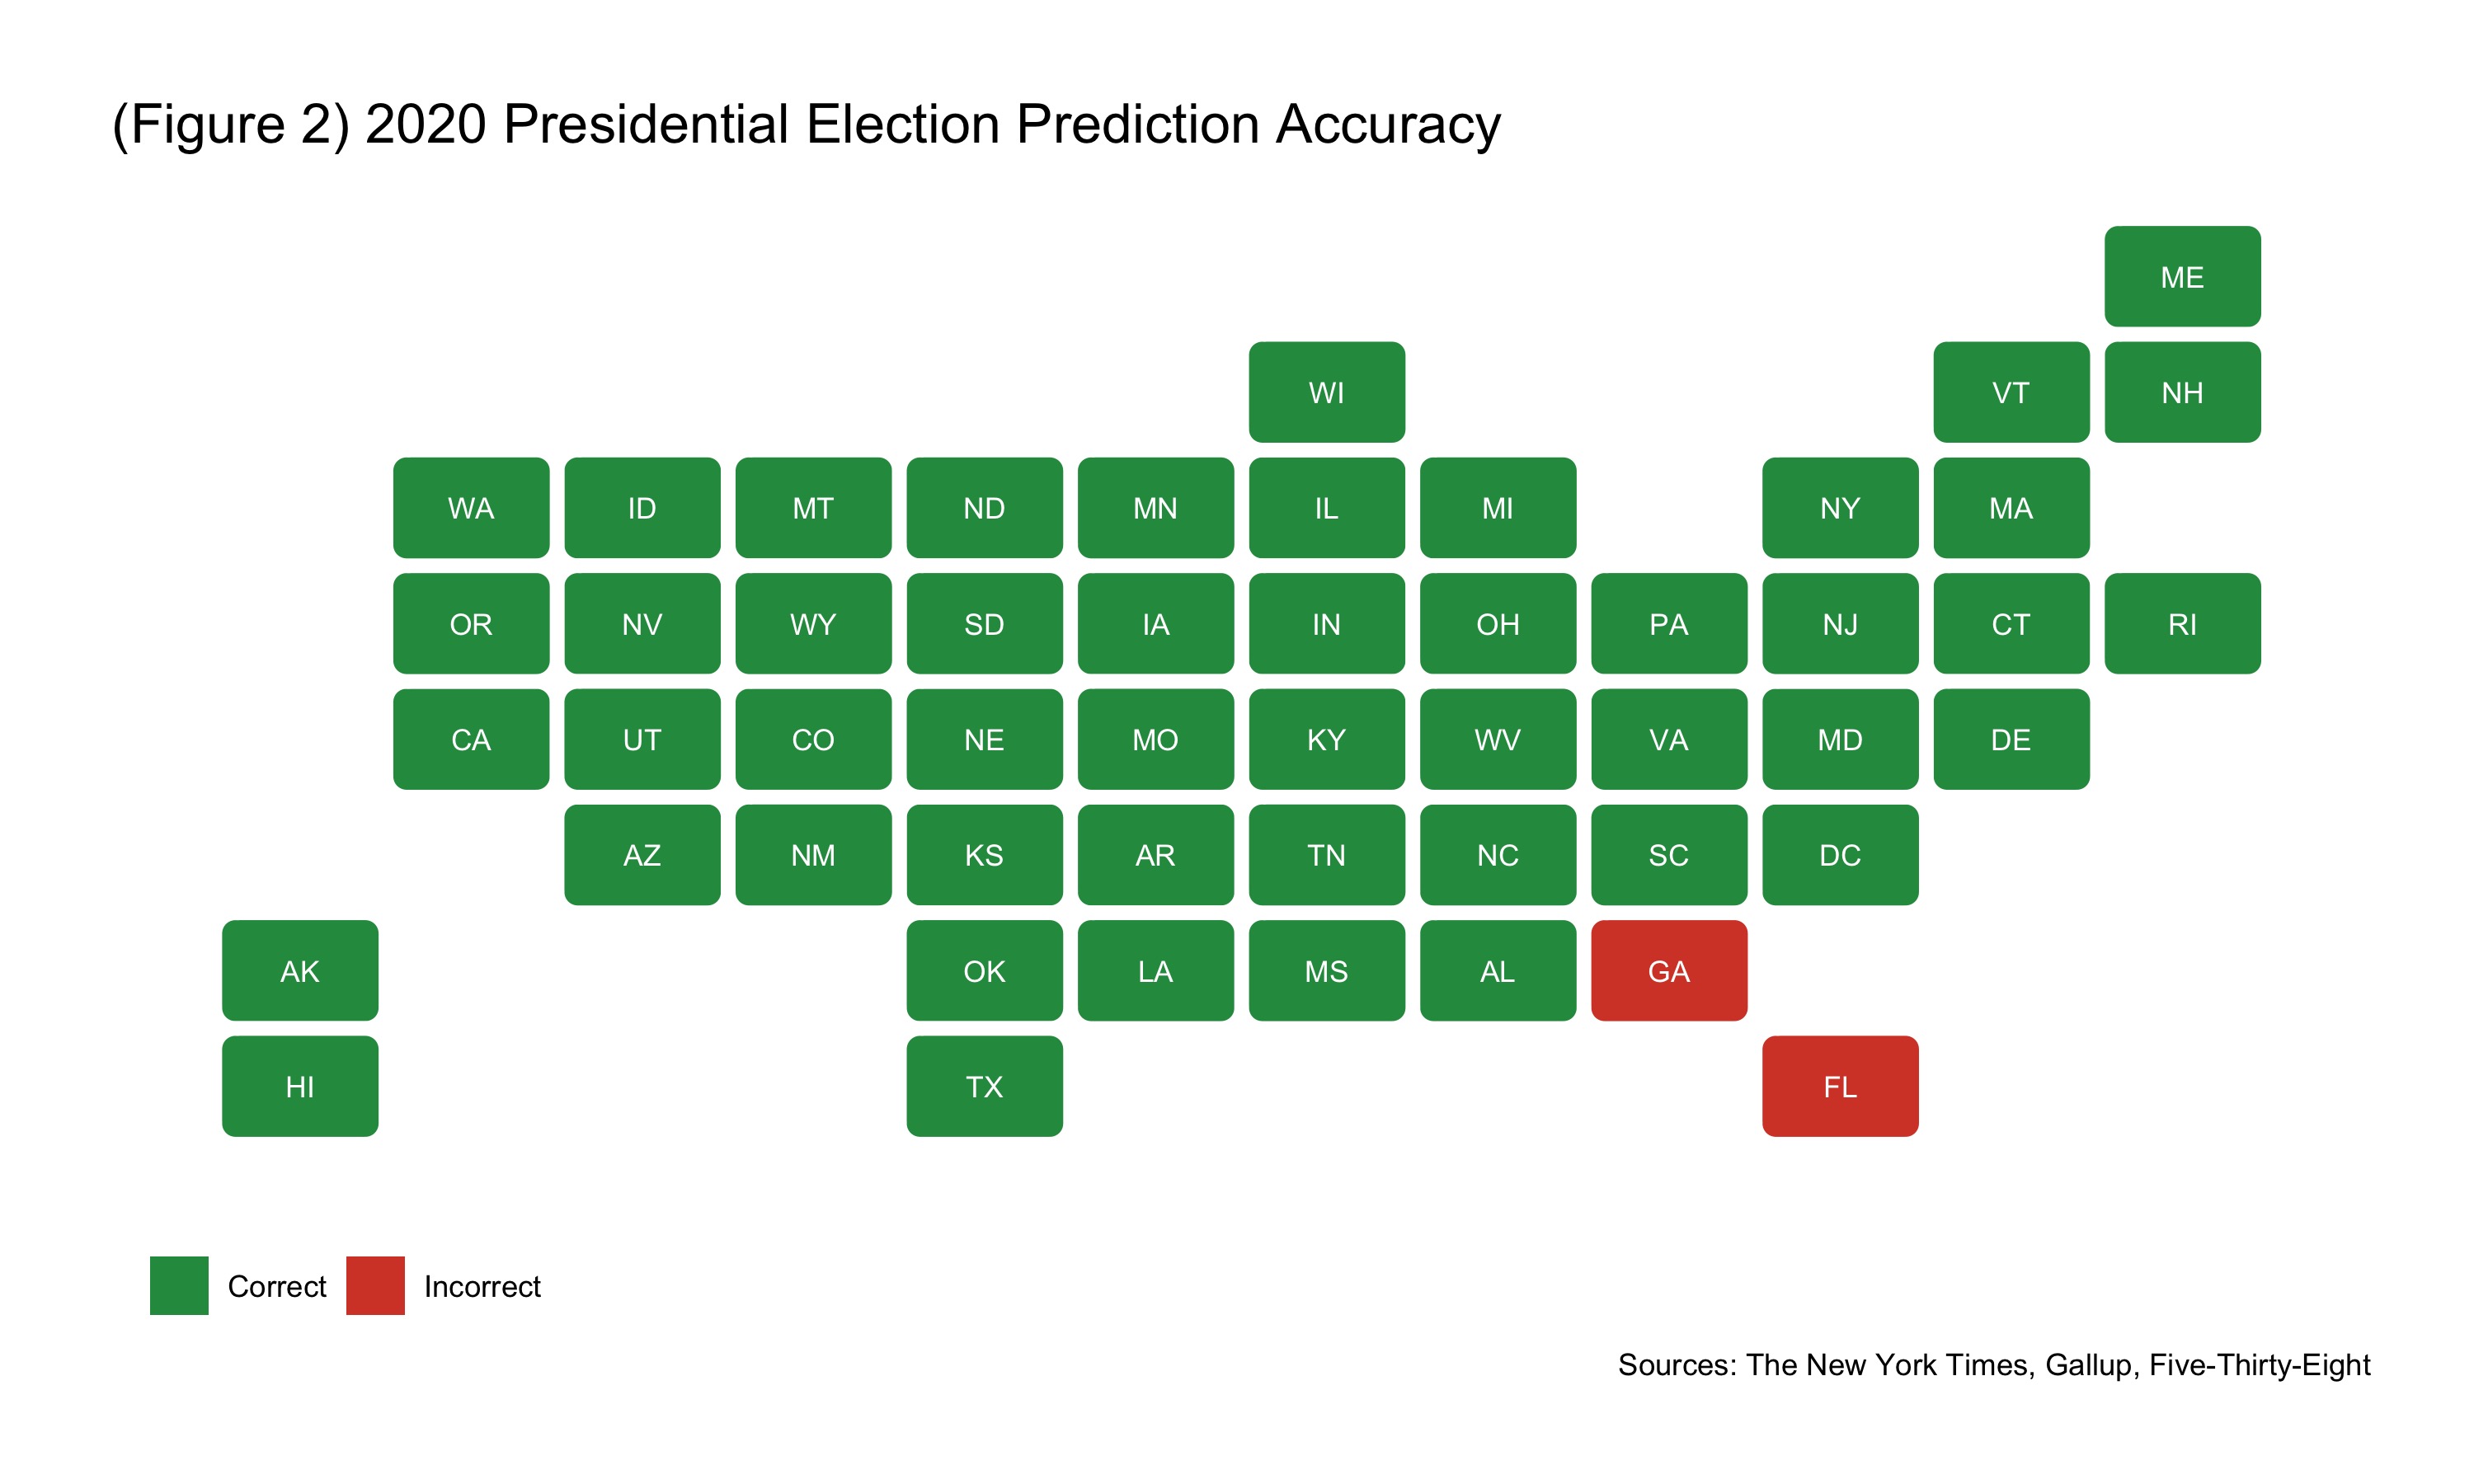
My model erroneously predicted that Trump would win Georgia and Biden would win Florida. Both are southern states that I categorized as toss-ups between the two candidates because my predictions were within 2% of a majority. Additionally, my model did not account for the split districts of Maine and Nebraska. However, this error canceled out in terms of electoral votes, as one vote from Maine went to Trump while one vote from Nebraska went to Biden.
My final electoral vote prediction was 319 Biden to 219 Trump, 13 votes off from the true electoral outcome of 306 Biden to 232 Trump. These 13 votes account for difference in Florida and Georgia’s number of electors, as I incorrectly predicted each state for the opposite candidate.
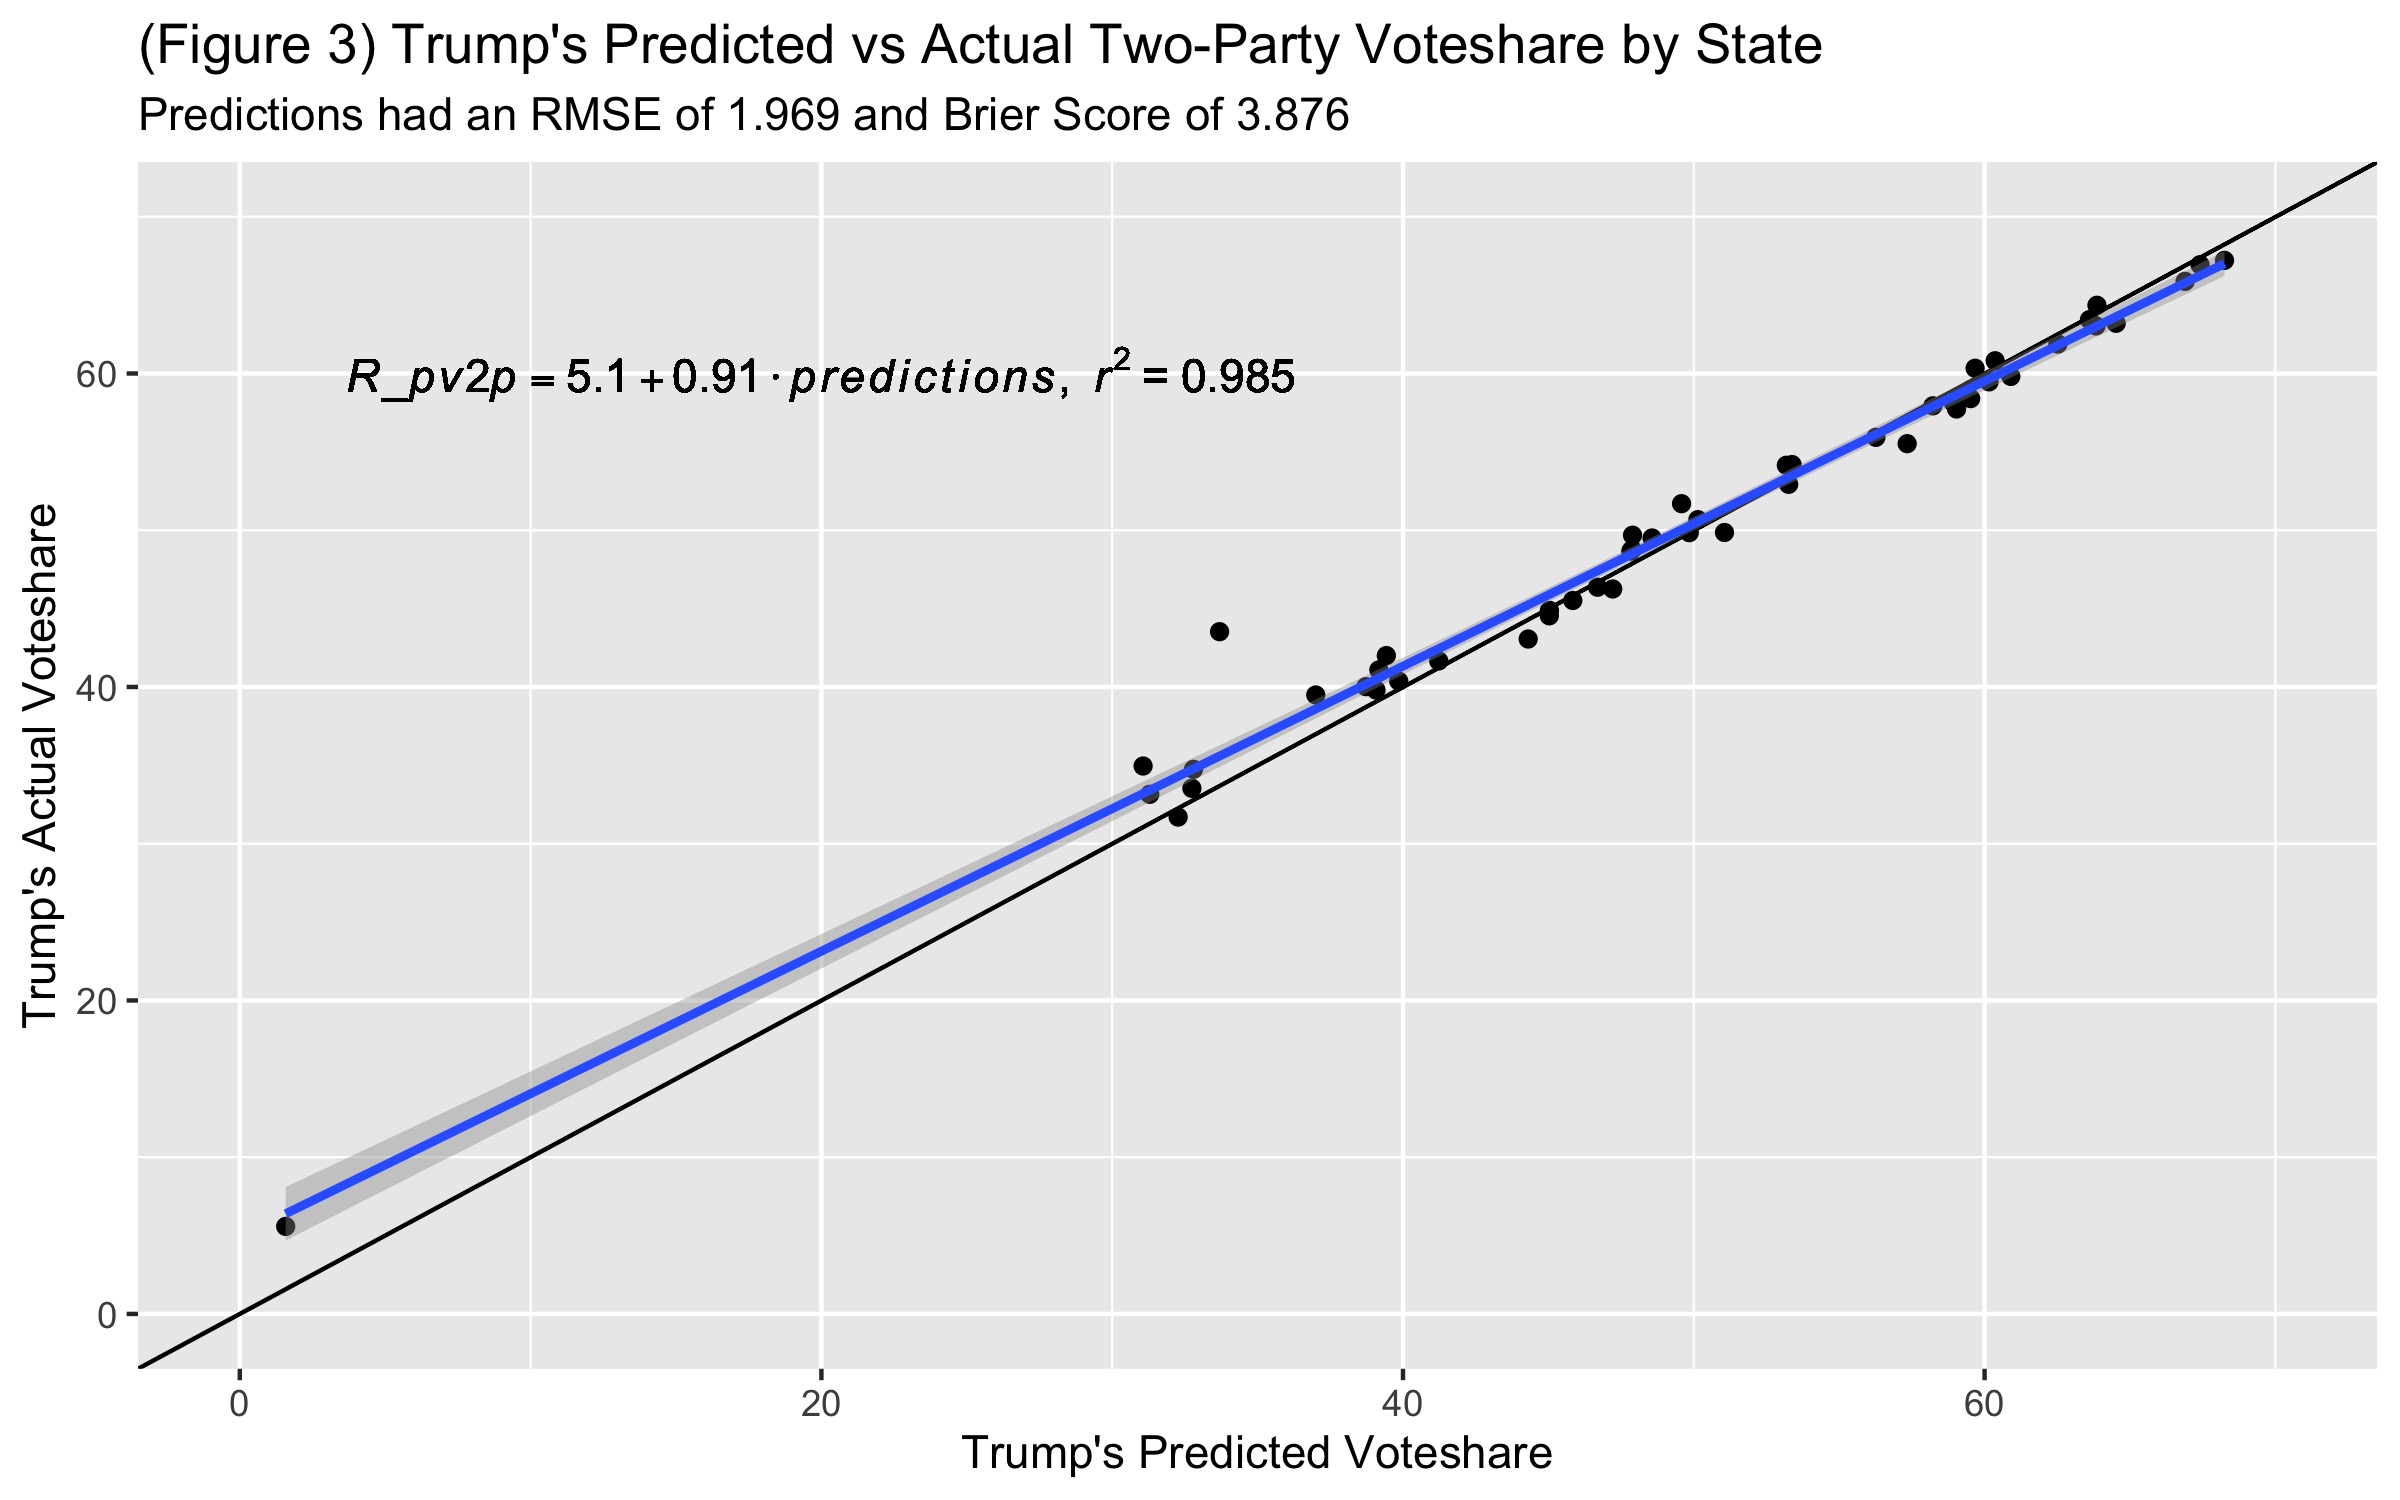
This graph visualizes the accuracy of my predictions for Trump’s two-party vote share in each state. The black y = x line signifies a perfect prediction, while the blue line shows the fit of my predictions to the true data. When creating a simple linear model between my model’s predictions for Trump and his true vote share by state, my predictions had a coefficient of 0.91 and intercept of 5.1. The R-squared for this fit was 0.985, meaning that 98.5% of the true state vote shares could be explained by my predictions. The point that strays farthest from the line of best fit is New York, which is most likely because the state has only reported 84% of its votes at this time.
Moreover, my model had an RMSE of 1.969 and a Brier Score of 3.876. RMSE measures the standard deviation of the residuals, or in this case, the variation in my error margins for each state. Brier score is a similar measure of accuracy, simply being RMSE raised to the second power.
Sources of Error
I hypothesize that polling inaccuracy and the use of short-term historical voting trends constitute my model’s primary sources of error.
Because Trump only narrowly won Florida in 2016, his low polling average of 46.9% likely led to my incorrect prediction of Biden winning the state. Quinnipiac, along with many other notable pollsters, predicted Democratic wins in the state of Florida for Hillary Clinton in the 2016 Presidential Election, Andrew Gillum in the 2018 gubernatorial race, Bill Nelson in the 2014 Senate race, and Biden in this election. Yet, the Republican party has won all four of these races in Florida. This consistency points to a systemic bias in the Democratic direction when it comes to Florida polls. However, this Democratic lean is not limited to the state of Florida:
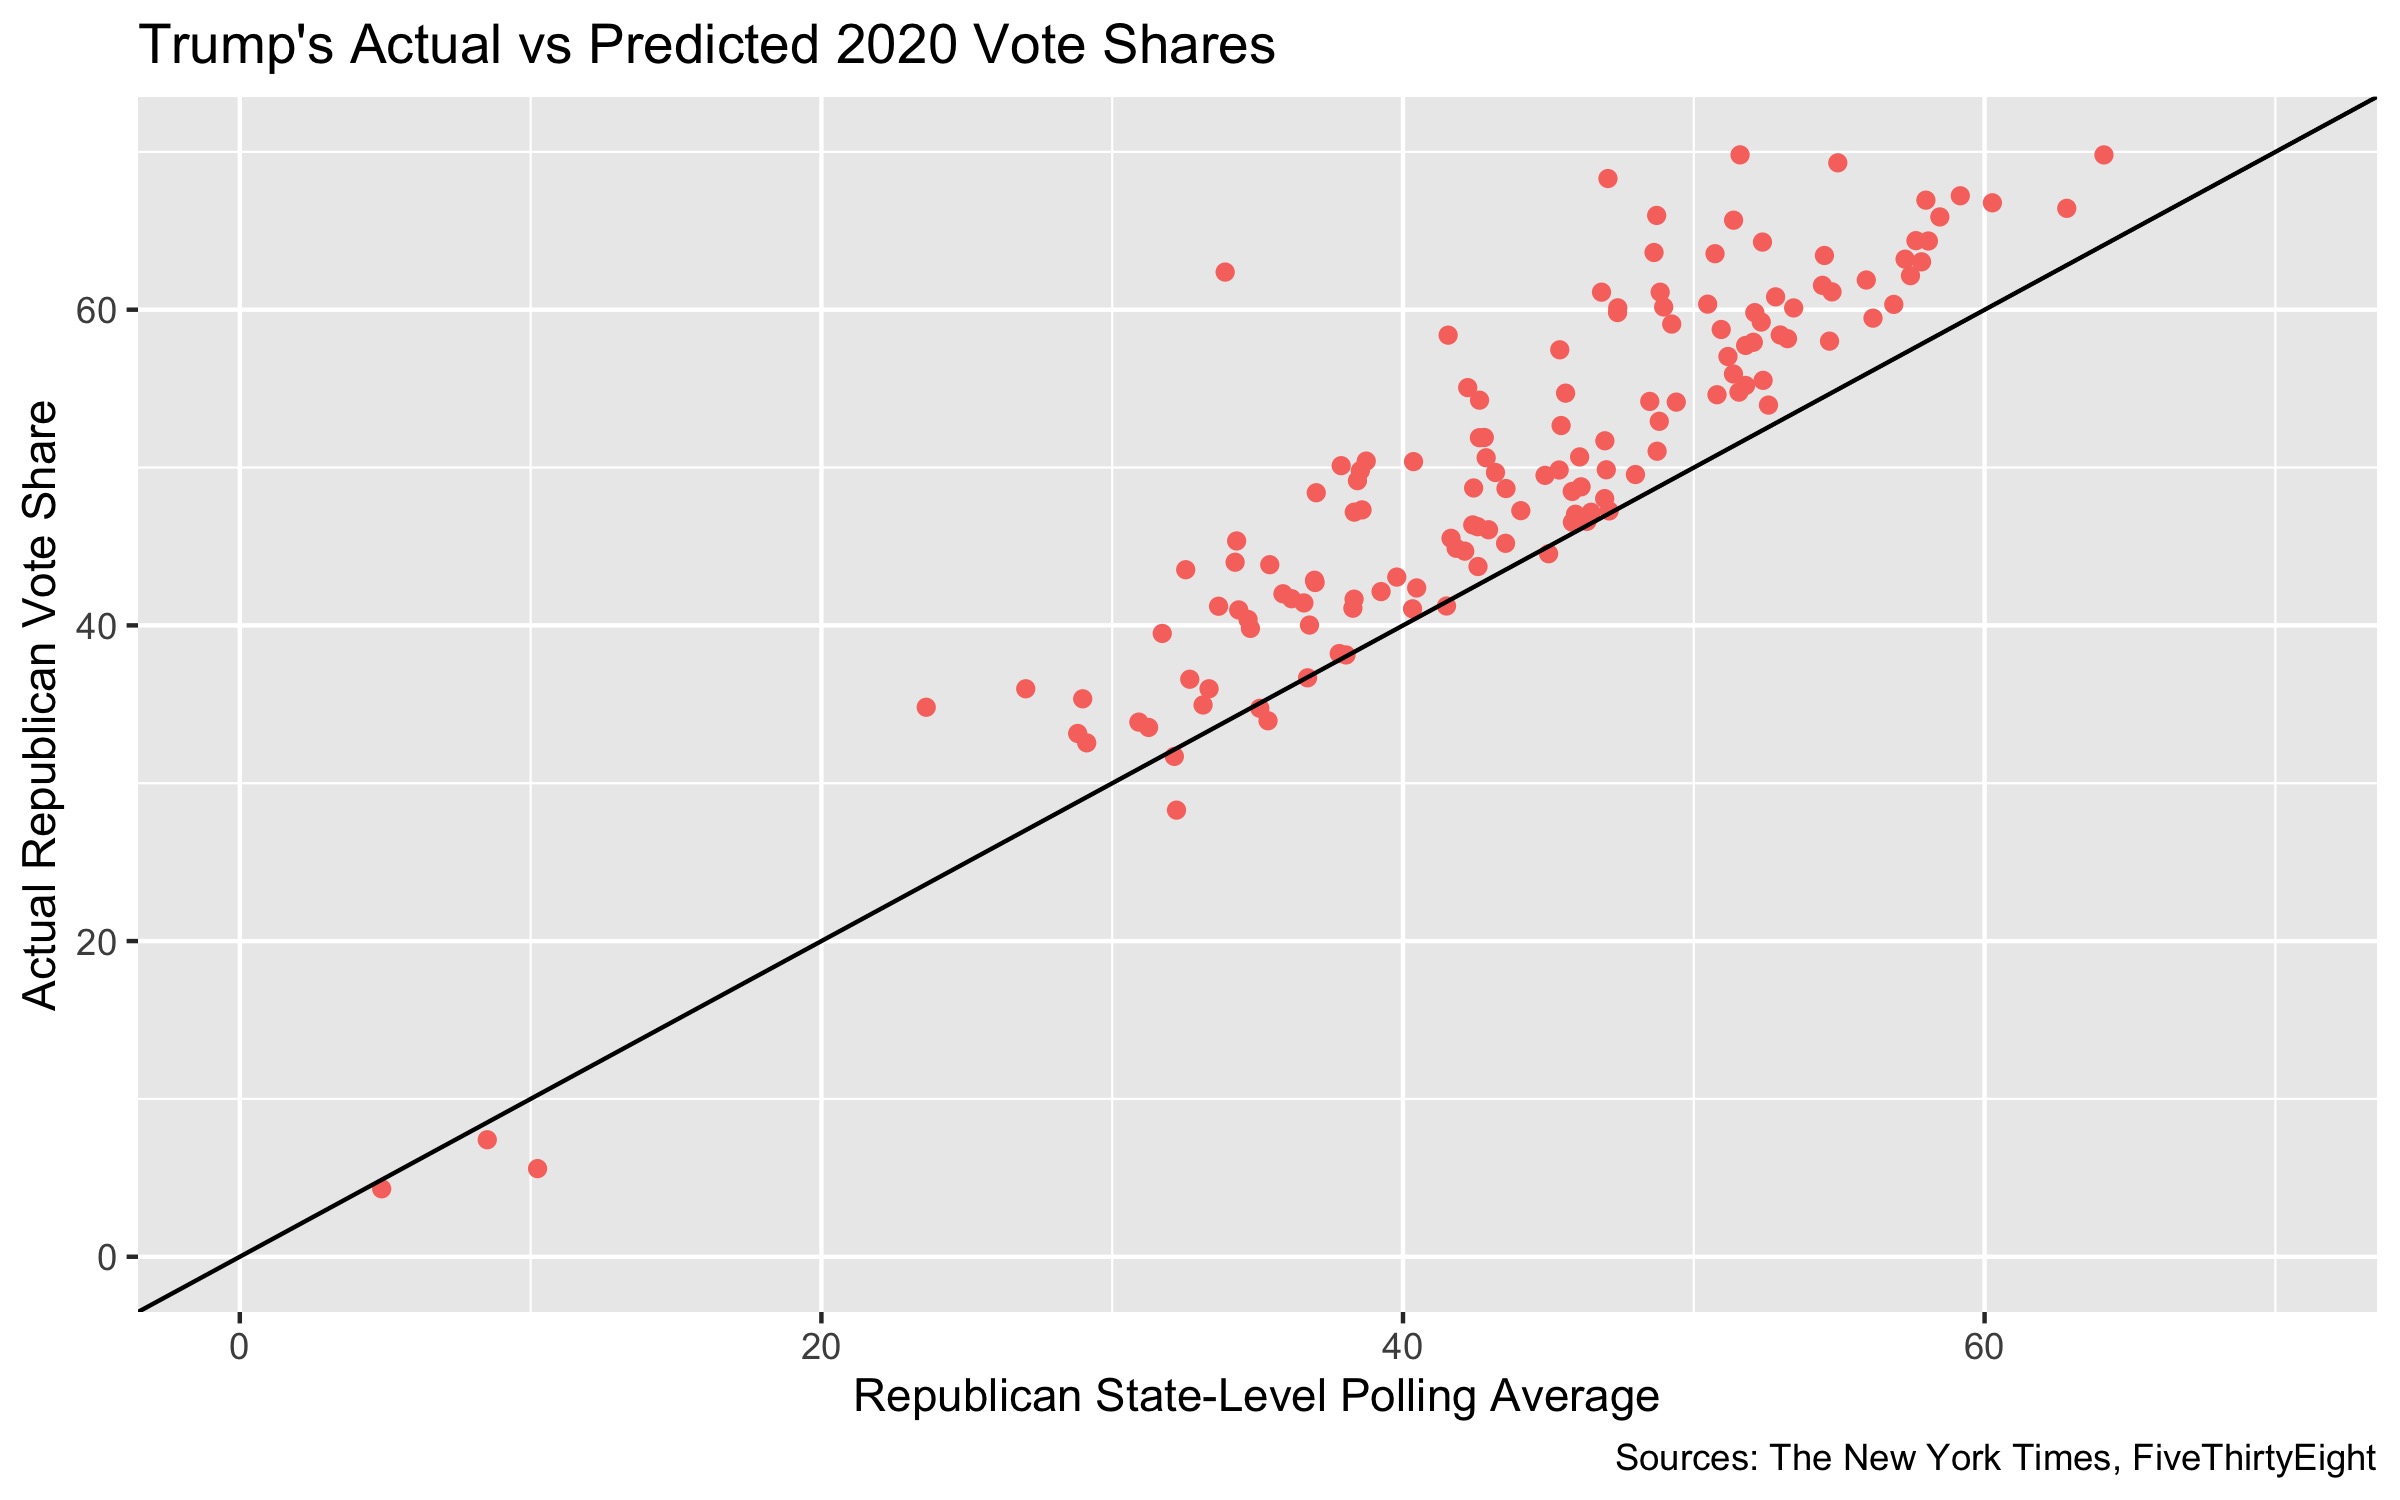
The graph above displays Republican presidential candidates’ pre-election polling averages for each state in the 2012, 2016, and 2020 elections plotted against their true state vote shares. The majority of the points are to the left of the y = x line, demonstrating how major pollsters in the last three presidential elections have consistently under-predicted the vote shares of Republican candidates at the state level. My other predictors did not successfully cancel out this polling error for Florida in 2020.
One cause for this Democratic polling bias in Florida and across the country may be disproportionately high survey response rates from Democrats. As the COVID-19 pandemic began and individuals spent their springs and summers quarantining, Democrats began to engage with polls and surveys at much higher rates. By connecting survey responses to voter files, it was revealed that there was a surge of survey responses from individuals who were linked to other Democratic institutions, such as individuals who are ActBlue donors. This phenomenon likely contributed to inflating polling numbers for Biden. I theorize that the opposite effect was present for Republican voters: the effect of voters falsifying their true preference for Trump due to social pressure and a lower engagement with polls and surveys deflated the true support for Trump in the state.
Another reason for the Democratic polling bias could be that pollsters did a poor job of choosing a sample that is representative of the electorate. The 2020 Presidential Election saw record voter turnout on both sides. The unprecedented turnout of this cycle posed a difficult challenge for pollsters, who were tasked with surveying a sample of people that is representative of an electorate that wasn’t yet fully understood. For example, this may have been a factor in Trump’s surprising performance among Hispanic voters, particularly Cuban-Americans. It was anticipated that Biden would experience a landslide victory within this group, but in the end he may just barely win the Hispanic vote in Florida. It’s possible that Trump-supporting Hispanic voters were not properly represented in the pollsters’ samples.
Another source of error was the way in which I incorporated historical voting trends. I believe that, for many states, using just the 2016 vote shares worked to my model’s advantage. For example, my correct predictions for Iowa and North Carolina were likely anchored by Trump’s win in the two states in 2016. For Georgia, however, Trump’s win in 2016 is likely what led to my incorrect prediction of him winning the state in 2020. The poll average that I incorporated predicted only a narrow win for Biden in Georgia, which abets my theory that the 2016 vote shares offset this specific prediction.
Discussion
If I were to redo my model, I would more aggressively vet, discard, and weight polls based on their 538 grades, rather than simply averaging all polls like my model did. By more heavily weighting pollsters that have accurately predicted difficult-to-poll states like Florida in the past and discarding pollsters with a significant partisan lean, I may have been able to diminish the negative effect of the exaggerated polling for Biden.
As you can see in figure 4, pollsters have consistently under-predicted Republican state vote shares for the last several presidential elections. Thus, another change I would make to my model is introducing a transformation to the polling data, shifting my predictions a small amount to correct for the consistent Democratic bias in recent elections.
Sources
Trump’s Florida Election Win Hinged on Big Gains in Miami-Dade
Polls Prove to Be 2020 Election’s Big Losers
A Look At Why Florida Presidential Polls Were Wrong
Why Florida’s Cuban population is susceptible to Trump’s propaganda
With this submission, I certify that all work is my own and has not relied on consultation with others. Where information or ideas are derived from others, it has been clearly recognized and acknowledged.